KATHMANDU: Deposits at banks and financial institutions (BFIs) increased by Rs 170 billion (2.6%) in the first quarter of current fiscal year, compared to an increase of Rs 158.50 billion (2.8%) in the same period of the previous year, according to a macroeconomic and financial situation report released by the Nepal Rastra Bank (NRB) on Tuesday.
|
Deposits at BFIs (Percentage Share) |
||||
|
Deposits |
Mid-July |
Mid-October |
||
|
2023 |
2024 |
2023 |
2024 |
|
|
Demand |
7.7 |
5.8 |
6.7 |
5.4 |
|
Saving |
26.6 |
30.3 |
26.7 |
32.7 |
|
Fixed |
58.8 |
56.4 |
60.2 |
54.8 |
|
Other |
6.8 |
7.5 |
6.4 |
7.1 |
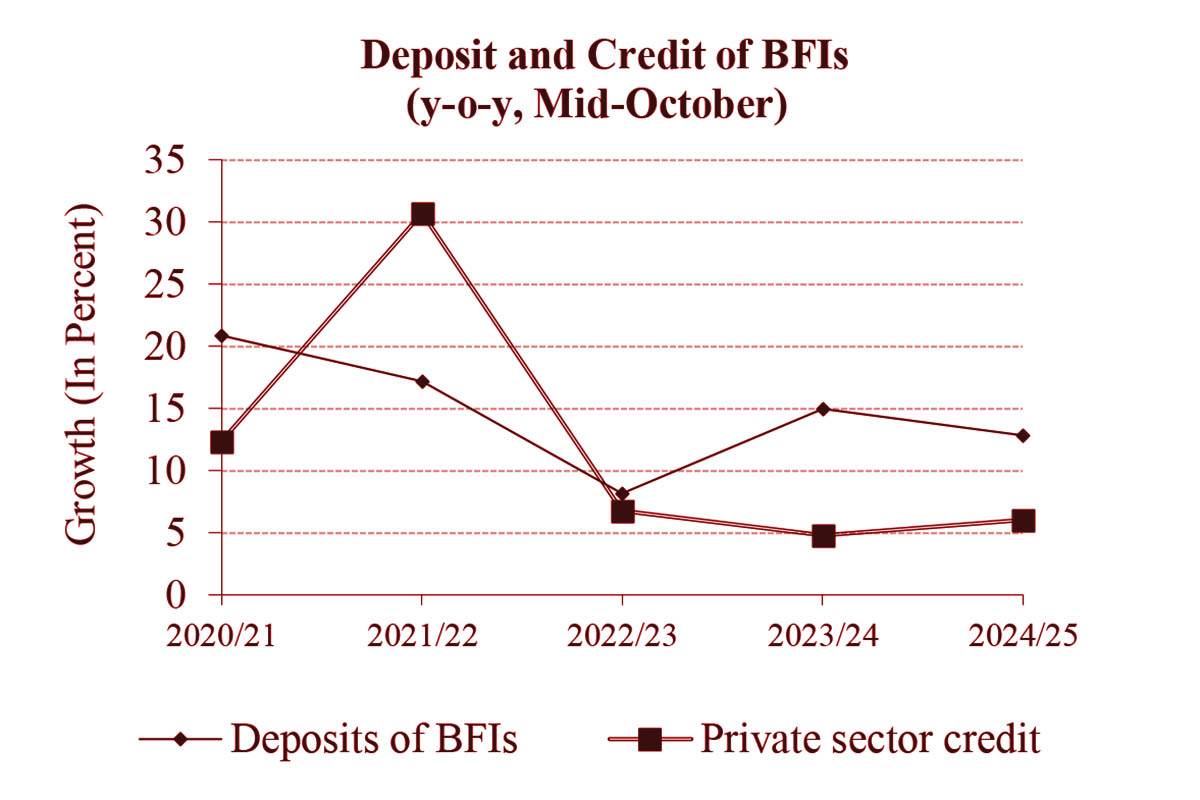
On a year-on-year basis, deposits at BFIs expanded by 12.8% in mid-October 2024.
The share of demand, savings, and fixed deposits in total deposits stood at 5.4%, 32.7%, and 54.8% respectively in mid-October 2024, compared to 6.7%, 26.7%, and 60.2% in the previous year.
The proportion of institutional deposits in total deposits of BFIs was 35.8% in mid-October 2024, slightly down from 36.0% a year ago.
Likewise, Private sector credit from BFIs increased by Rs 128.65 billion (2.5%) in the first quarter of the current fiscal year, compared to an increase of Rs 109.03 billion (2.3%) in the corresponding period of the previous year. On a year-on-year basis, credit to the private sector from BFIs increased by 6.0% in mid-October 2024.
The shares of private sector credit from BFIs to non-financial corporations and households stood at 64.0% and 36.0% respectively in mid-October 2024, compared to 63.1% and 36.9% a year ago.
Private sector credit from commercial banks, development banks, and finance companies increased by 2.5%, 2.4%, and 3.9% respectively.
As of mid-October 2024, 13.4% of the total outstanding credit of BFIs was against the collateral of current assets (such as agricultural and non-agricultural products), and 65.8% was against land and buildings. These ratios were 12.0% and 67.3% respectively a year ago.
During the review period, the outstanding loan of BFIs to the industrial production sector increased by 2.3%, the construction sector by 2.2%, the wholesale and retail sector by 2.3%, the transportation, communication, and public sector by 4.7%, the service industry sector by 2.6%, and the consumable sector by 2.2%, while the agriculture sector decreased by 0.4%.
Term loans extended by BFIs increased by 2.7%, margin nature loans by 17.5%, trust receipt (import) loans by 17.4%, hire purchase loans by 0.7%, cash credit loans by 1.9%, and real estate loans (including residential personal home loans) increased by 1.5%, while overdraft loans decreased by 5.8%.
Liquidity Management
In the first three months of the current fiscal year, NRB absorbed total liquidity of Rs 7,833.40 billion, including Rs 590.55 billion through deposit collection auctions and Rs 7,242.85 billion through the Standing Deposit Facility (SDF). In the corresponding period of the previous year, a net amount of Rs 363.45 billion in liquidity was injected through various instruments of open market operations, including the Standing Liquidity Facility (SLF) and the Overnight Liquidity Facility (OLF).
In the first quarter of fiscal year 2024/25, the central bank injected liquidity of Rs 196.79 billion through the net purchase of $1.47 billion from the foreign exchange market. In the same period of the previous year, Rs 166.54 billion in liquidity was injected through the net purchase of $1.26 billion.
The NRB purchased Indian currency (INR) equivalent to Rs 115.66 billion through the sale of $822 million in three months. In the corresponding period of the previous year, INR equivalent to Rs 95.54 billion was purchased through the sale of $720 million.
Inter-bank Transactions
In the first quarter of the current fiscal year, BFIs' inter-bank transactions amounted to Rs 402.45 billion on a turnover basis, including Rs 371.25 billion in inter-bank transactions among commercial banks and Rs 31.20 billion among other financial institutions (excluding transactions among commercial banks). In the corresponding period of the previous year, such transactions totalled Rs 1,494.08 billion, including Rs 1,309.73 billion among commercial banks and Rs 184.35 billion among other financial institutions (excluding transactions among commercial banks).
Interest Rates
The weighted average 91-day treasury bill rate remained at 2.96% in the third month of 2024/25, down from 4.94% in the corresponding month a year ago. The weighted average inter-bank rate among BFIs increased to 3.00% in the review month, from 2.26% a year ago.
The average base rates of commercial banks, development banks, and finance companies stood at 7.29%, 9.13%, and 10.35% respectively in the third month of 2024/25, compared to 9.94%, 12.30%, and 13.65% respectively in the corresponding month a year ago.
|
Weighted Average Interest Rate (per cent) |
||
|
Types |
Mid-October 2023 |
Mid-October 2024 |
|
91-day treasury bills rate |
4.94 |
2.96 |
|
Inter-bank rate of BFIs |
2.26 |
3 |
|
Base rate |
||
|
Commercial banks |
9.94 |
7.29 |
|
Development banks |
12.3 |
9.13 |
|
Finance companies |
1365 |
10.35 |
|
Deposit rate |
||
|
Commercial banks |
7.9 |
5.24 |
|
Development banks |
9.36 |
5.94 |
|
Finance companies |
10.19 |
7.21 |
|
Lending rate |
||
|
Commercial banks |
12.11 |
9.33 |
|
Development banks |
13.91 |
10.63 |
|
Finance companies |
14.61 |
11.86 |
Weighted average deposit rates of commercial banks, development banks, and finance companies stood at 5.24%, 5.94%, and 7.21% respectively in the review month, compared to 7.90%, 9.36%, and 10.19% respectively in the corresponding month a year ago.
Similarly, the weighted average lending rates of commercial banks, development banks, and finance companies stood at 9.33%, 10.63%, and 11.86% respectively in the review month, compared to 12.11%, 13.91%, and 14.61% respectively in the corresponding month a year ago.


