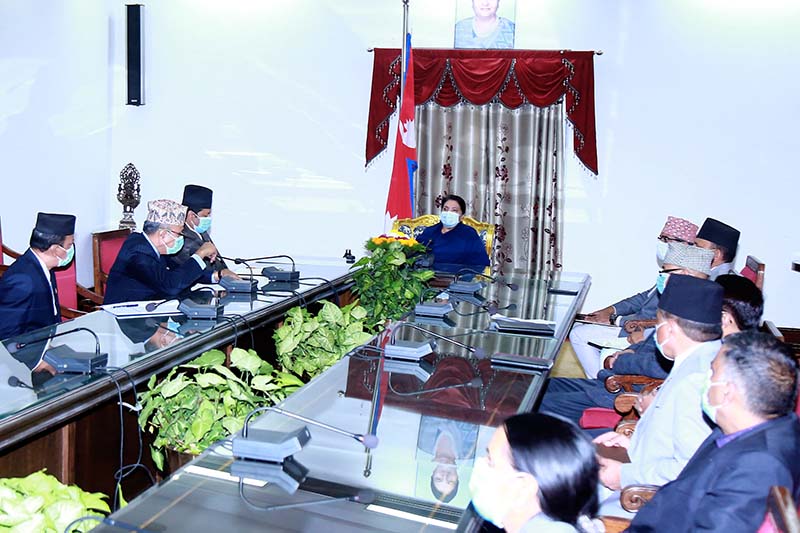
KATHMANDU: The female population is seen further increasing in this census as compared to the previous one. The Central Bureau of Statistics (CBS), a body under the National Planning Commission, released the preliminary results of the National Population Census 2021 on Wednesday.
As per the preliminary results of the National Population Census-2021, the total population of the country is 29,192,480. Of the total population, 14,901,169 (51.04%) are women and 14,291,311 (48.96%) are men. The National Population Census-2011 counted the total population of Nepal at 26,494,504 and of this male population constituted 48.5 % and the female population 51.5%.
The preliminary results of the 2021 population census show that the gender ratio (the number of males per 100 females) is 95.91. The gender ratio as per the 2011 Census was 94.16. The total population as counted in the latest census is more by 2,697,976 compared to the total population as per the 2011 census.
This shows that Nepal's population has increased by 10.18% in 10 years. The average annual population growth rate in the last decade is 0.93% and it was 1.35% in the previous census.
The first phase fieldwork of the 2021 Census was carried out from September 15 to October 4 and the second phase fieldwork was done from November 11 to 17, 2021. One thousand eight hundred and seventy-one employees were mobilised for managerial work of the National Population Census 2021 at the province and district level while around 8,500 supervisors and 39,000 enumerators were engaged in the fieldwork. The forms (house and household listing form, main questionnaire and community questionnaire) filled with the conclusion of the two-phase fieldwork were collected at the CBS and the data processing was begun.
Number of increased families As per the preliminary results, the number of families normally residing in Nepal is 6,761,059 and they are found living in a total 5,643,945 houses. According to this, 12 families on average are found living in 10 houses. The number of families at present has increased by about 24.57% compared to a decade back. A total of 1,333,757 families have been added during this period. Likewise, the family size is 4.32 persons per family. The family size as per the 2011 Census was 4.88 persons per family. There are roughly 4.25 persons per family in the urban area while 4.55 persons per family in the rural areas. The family size ten years back was 4.32 persons per family in urban areas and 5.02 persons per family in rural areas. Geographical region-wise, the family size is 4.27 persons per family in the mountainous region, 3.95 persons per family in the hilly region and 4.65 persons per family in the Tarai region. On a province-wise basis, the average number of family members is the lowest in Gandaki province (3.36 persons per family) and the highest in the Madhes province (5.66 persons per family). This was 4.16 and 5.80 persons per family respectively as per the 2011 census. District-wise, Dolakha district has the lowest size family (3.41 persons) and Rautahat has the largest size family of 5.92 persons.
Population increases in Tarai According to the geographical region, the distribution of the total population of the portion of the Tarai region has been found increased in 2021 as compared to 2011. As per the 2011 Census, 50.27% component of the total population was in Tarai and this has increased to 53.66% in 2021. The mountainous region had 6.73% component of the total population in 2011 and it has decreased to 6.09% in 2021. Similarly, the hilly region had 43.01% component of the total population in 2011 and it has decreased to 40.25% in 2021. The gender ratio has decreased by 1% point in the Tarai while it has increased by 3% points in the mountainous and 4% point in the hilly region in a period of ten years. It was 94, 91 and 97 in the Mountainous, Hilly and Tarai region respectively in the 2011 census and stands at 97, 95 and 96 in the Mountainous, Hilly and Tarai regions respectively in 2021. Looking at the annual population growth rate, it is negative (- 0.02%) in the Mountainous region, positive by minuscule (0.29%) in the Hilly region and highly positive (1.56%) in the Tarai region as compared to the rest of the geographical regions.
Province-wise population change and growth rate Considering province-wise population distribution, the Madhes province has the highest population (6,126,288) and Karnali province has the lowest population (1,694,889), which is 20.99% and 5.81% respectively of the total population. The gender-wise analysis shows that Madhes province has the largest gender ratio at 101 while the Sudurpaschim province has the lowest gender ratio at 90. The annual population growth rate is highest in Lumbini province and the lowest in Gandaki province. Lumbini province has 1.25% per annum population growth rate while it is 0.30% per annum in Gandaki province. The Madhes province has the second-highest population growth rate. Its population growth rate is 1.20% per annum. The rest of the provinces have less than 1% population growth rate.
Kathmandu has the highest population and Manang the least Among the 77 districts across the country, Kathmandu has the highest population at 2,017,532 while Manang has the least at 5,645. Morang has the second-highest population while Rupandehi has the third-highest, Jhapa fourth and Sunsari fifth. Mustang comes second in terms of least population while Dolpa, Rasuwa and Humla come thereafter. In terms of gender ratio, Manang has 130, the highest, while Pyuthan has 82, the lowest. A total of 32 districts from hill and mountain regions have a declining rate of population. As compared to the previous census in 2011, Bhaktapur has the highest population growth rate at 3.32 per cent while Ramechhap has the most declining rate of the population at -1.65%. Among the mountainous districts, Mugu has the highest population growth rate at 1.80%. Considering Metropolis, Sub-Metropolis and Municipality as urban place and rural municipality as the rural area, 66.08% of the total population live in urban area. In the previous census in 2011, there were 58 municipalities and 17.07% population dwelt in urban areas while remaining 82.93% lived in rural areas. According to the preliminary results of the National Census 2021, among the metropolis and municipalities, Kathmandu, Pokhara, Bharatpur, Lalitpur and Birgunj had the highest population while Thuli Bheri, Tripurasundari, Madi, Laliguras and Jiri municipality had the least population respectively. Kathmandu Metropolitan City recorded 865,906 population while Thulibheri recorded the least population at 10,187. There are a total of 14 municipalities having below 20,000 population while 39 municipalities had over 100,000 population. Among the rural municipalities, Baijanath Rural Municipality in Banke district reported the highest population at 70,315 while Narpabhumi Rural Municipality in Manang reported the least at 442. A total of 46 rural municipalities had below 10,000 population while those rural municipalities having over 50,000 population are 15. When it comes to density, population density in Nepal remains at 198 per square kilometre which was 180 per square kilometre in 2011. Geographically, the Tarai region has the highest density at 461 against 392 per square kilometre in 2011 while the mountainous region has the same 34 per square kilometres in both 2011 and 2021. District-wise, Kathmandu district has the highest population density at 5,108 per square kilometre while Manang has the lowest density at 3 per square kilometre. Bhaktapur, Lalitpur, Dhanusha and Mahottari are the second, third, fourth and fifth densest districts respectively after Kathmandu. Similarly, the preliminary result of the census of 2021 puts the number of Nepalis abroad at 2,169,478. Among them 1,762,315 (81.28%) were male and the remaining were female. This number of people were absent during the census recording and were said to be abroad. In the 2011 census, the number of people staying abroad stood at 1,921,494 among them 1684029 (86.62%) were male and the remaining were female. The exodus of females abroad has increased by 71.09% during a decade. By RSS READ ALSO:
Published Date: January 27, 2022, 12:00 am
Post Comment
E-Magazine
RELATED B360 National


