Just like the pendulum swung in the Cricket World Cup final between England and New Zealand, the commodities market transformed since its modest beginnings of 2019. While the finals provided a spectacle for the fans rejuvenating the dying format of the game, the commodity markets also garnered huge following and attention among ardent traders as the year unfolded. As we complete the first half, this article will try to dissect the events and driving elements of the major commodities and the possible way forward for the remaining of 2019.
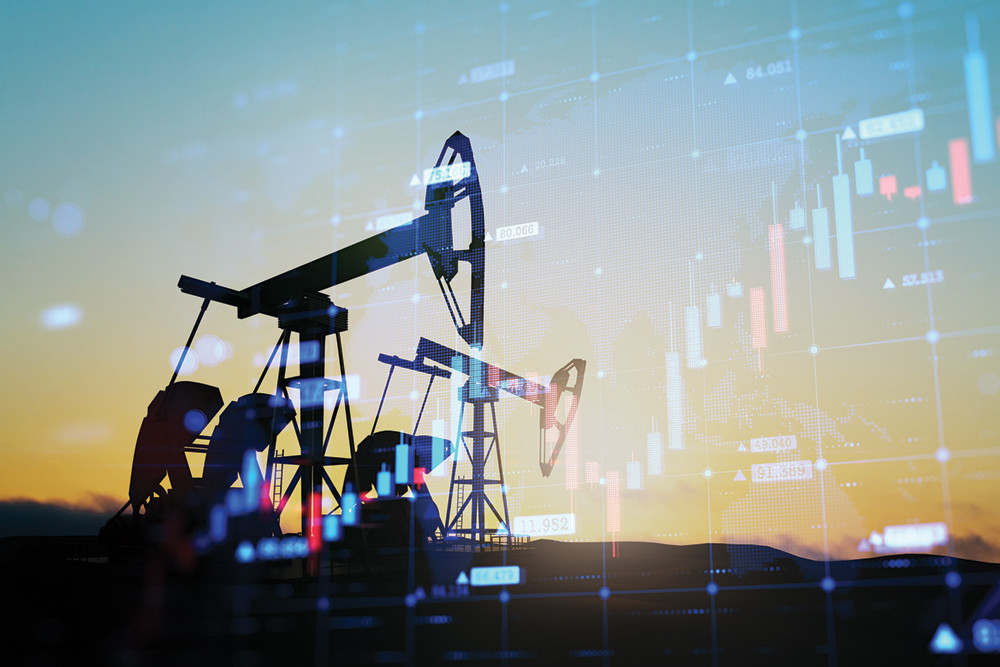
Its Déjà vu for Oil Markets
In a repeat performance of last year, crude oil rose from the ashes to attain the title of the best performing commodity with an incline of 28.76%. After going through shambolic times in the second half of 2018, crude oil opened at $45.78 per barrel and reached the highest price of $60.49 per barrel in April. The prices were influenced eventually by the conundrum confronting the Middle East region along with the supply cuts extended by OPEC and its allies. The oil markets were pressurised due to the global growth concerns but the prices surged after two tankers were attacked near the Strait of Hormuz which the US blamed Iran. OPEC settled on maintaining the quotas for the next nine months at a meeting in Austria. Saudi Arabia, the dominant producer in the OPEC cartel, will also likely continue to do the heavy lifting as per market pundits.
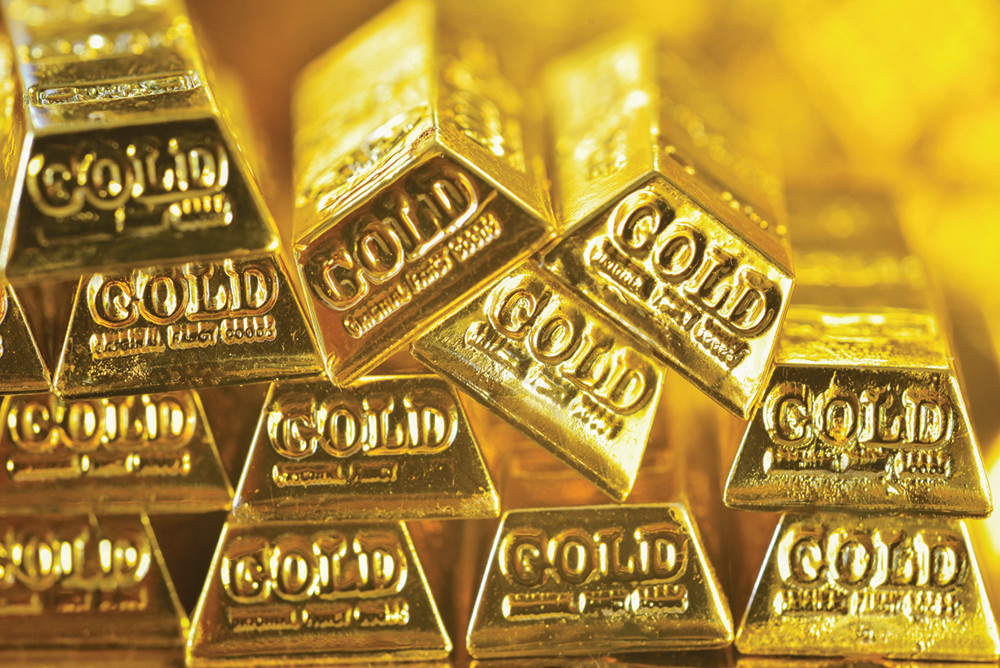
Precious Metals: Charting Higher Grounds
The precious metals bracket was relatively on bullish grounds for most of the first half of 2019. Having commenced at $1282.09 per troy ounce, gold prices crossed the resistance level of $1400 and reached the price of $1438.84 per troy ounce on June 25, the highest since June 2013. However, the game-changer in the precious metals basket went to palladium. In the first month of 2019, palladium - a key metal in catalytic converters - became the most sought after precious metal after it surged ahead of gold for the first time since 2002. The metal broke the level of $1600 per troy ounce during the process although it has lost some steam since.
Among the many contributing factors, the accelerating demand due to the tough emission standards coupled with supply deficits has lead palladium to outperform the other commodities. Since around 80% of all palladium and platinum suppliers are highly concentrated in South Africa and Russia alone, the metals are benefitting from the heightened geopolitical risks.
The gold to silver equation took a turn. While the average for the past 20 years was that 65 ounces of silver can purchase one ounce of gold, last June, the ratio was 90 ounces of the white metal to procure one ounce of the yellow metal. This indicates that while the demand of the bullion has hiked given the negative yields and fears of slowing economic growth, silver has continued to trade sideways. Since the usage of silver is predominantly in the industrial sector, the cooling of this sector has proved to be the major component in the slowing demand of the white metal.
Copper: An Average Show
Copper has trudged along in an average trend giving company to its industrial cousin, silver. At the beginning of the year, market pundits opined that this could be the year for copper given the higher demand related to renewable energy. However, the trade war between China and USA put to rest any bullish hopes.
All is not lost still. According to Bloomberg, copper usage should top world production by approximately 189,000 metric tons in 2019. The largest miner in the world, Codelco, stated that the demand in China remained unchanged despite the trade tensions and that the recent selloff was eventually not justified.
Natural Gas: On a Downward Spiral
While most commodities trudged along with the bullish territories, natural gas preferred to observe a negative stance in the first half of 2019. Going down by 21.5%, natural gas was the worst-performing commodity. Given that the US has an adequate supply of energy production thanks to the fracking industry, many analysts were not at all surprised by the result. In 2018, the US gas production inclined to a record of 37 trillion cubic feet, a significant 44% increase from only a decade ago. The US provides around 21.5% of supply last year coinciding with the title of being the world’s gas production leader.
Way Forward
While the first half looked positive from all fronts, the second half could provide some surprises. Although the markets could stray away from the positive path now and then, the driving forces i.e. the trade war and the slowing global growth, could curtail the headwind and provide impetus to gain further grounds in the second half of 2019.
Vivek Risal is associated with Mercantile Exchange Nepal Limited in the capacity of Manager in Research and Development Department. He can be contacted at r&[email protected]